Customer engagement success is a marathon, not a sprint. In fact, some marketers would say it’s more like an ultra-marathon. With thousands or even millions of users interacting with your brand daily, it can be difficult to know which marketing efforts are actually moving the needle.
Returning customers spend 67% more on average than new buyers, and brands with mature digital engagement strategies report a 123% increase in revenue. There’s a substantial financial incentive behind prioritizing user satisfaction. The right customer engagement analytics will give you valuable insights into how to connect with your audience, generate ROI, and boost your bottom line.
Understanding Customer Engagement Analytics
Customer engagement analytics are formulas and tools used to calculate the success of your customer engagement strategies. You can track a wide range of indicators, including customers’ emotions and loyalty and campaign results.
These metrics are designed to help you identify the highest and lowest-performing aspects of customer experience, enabling you to make data-driven decisions on where to allocate budget and resources. Improving the customer experience is an integral part of any business’ success, helping paint a picture of buyer preferences and effective engagement strategies.
How to Choose the Right Metrics for Your Business
- Consider your business objectives: Develop customer engagement KPIs and identify how they positively impact your wider business objectives. Then, consider metrics that align with these targets.
- Think about the whole customer lifecycle: Select metrics relevant to each stage of the customer journey, right from the initial awareness stage to post-purchase.
- Identify the tools you have at hand: The metrics you track may depend on the data analytics tools you use. For example, marketing automation tools and social media channels often provide analytics for you.
- Keep making changes: You can add or remove the necessary metrics as your business grows and scales.
Customer Engagement Analytics: 7 Must-Have Metrics to Track
1. Net Promoter Score (NPS)

Source
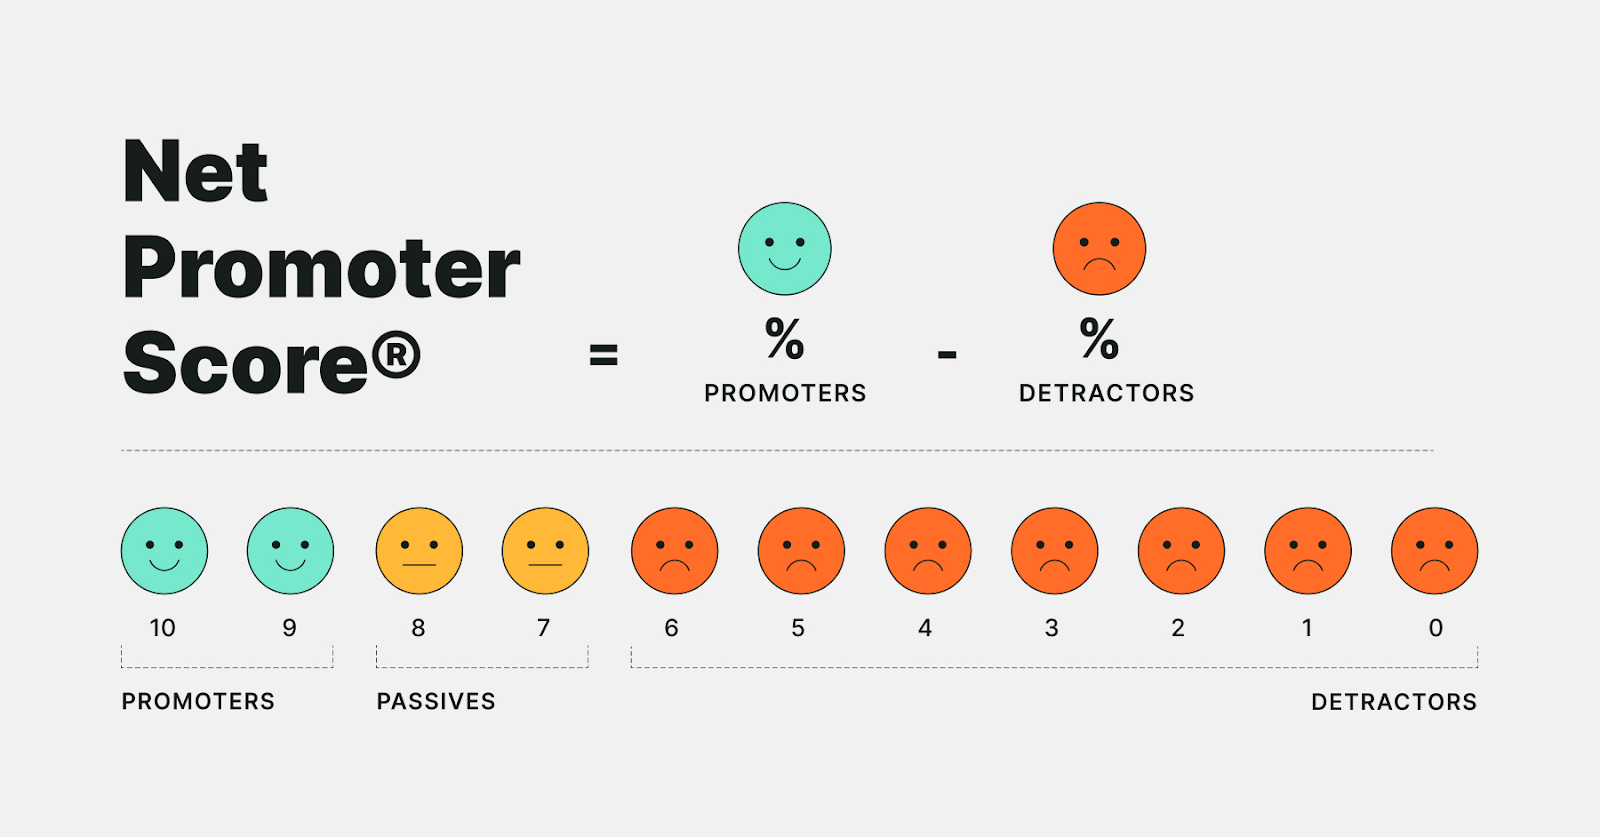
An NPS is the ultimate measure of customer sentiment. Before social media, the internet, and digital marketing, we had old-fashioned word of mouth. Although marketing has evolved, customer recommendations still stand as an essential measure of customer loyalty.
One of the best ways to measure NPS is to survey customers using open-ended questions. Answers are usually based on a sliding scale of 1-10. For example, “On a scale of 1-10, how likely are you to recommend X product to a friend?”
Customers can be split into different categories:
- Loyal customers respond with 9 or 10. They are highly engaged with your brand and likely to recommend you.
- Passive customers respond with 7 or 8. They are moderately interested in your brand, unlikely to recommend you but equally unlikely to give you bad reviews.
- Detractor customers respond with a 6 or lower. They are likely to give you negative reviews and harm your brand image.
How to Calculate NPS
NPS = % of promoters – % of detractors
2. Conversion Rate (CR)
Calculating conversion rate is one of the most important and relevant KPIs for every business, large or small. It can vary between campaigns because the conversion rate measures the percentage of users who complete a desired action. For example, the action could be:
- Making a purchase.
- Clicking a LinkedIn ad.
- Signing up for an email newsletter.
- Opening a video message you’ve shared via SMS.
Tracking CR helps you pinpoint the ROI of your marketing efforts, campaign progress, and highest-performing channels.
How to Calculate Conversion Rate
CR = [Number of desired actions completed / Total number of leads] X 100
3. Average Resolution Time
No business is perfect, so it’s critical to dedicate time and resources to customer support to increase customer satisfaction. Average resolution time (ART) is the average time your customer support team takes to fully resolve a customer’s issue or inquiry. This timeframe usually begins when a customer initiates contact (e.g., submits a support ticket, sends an email, or starts a live chat) and ends when the case is closed.
How to Calculate Average Resolution Time
ART = Total resolution time for all resolved cases / Total number of issues resolved
4. Customer Satisfaction Score (CSAT)

Source
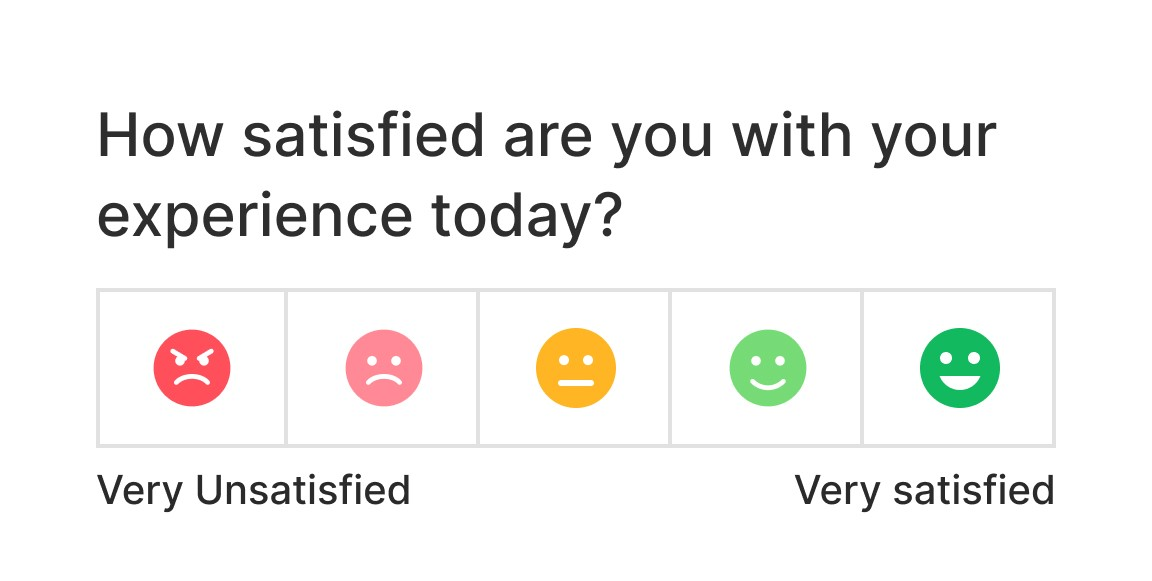
The CSAT does what it says on the tin: it is a metric to measure how satisfied customers are with your brand. The best time to calculate this score is after a customer has made a purchase.
Calculating CSAT can be as simple as adding a pop-up on your website with a prompt: “How satisfied were you with your shopping experience today?” Provide a scale of 1-10 so customers can quickly click and provide their response.
How to Calculate Customer Satisfaction Score
CSAT (%) = (Total positive responses / Total responses) X 100
5. Customer Lifetime Value (CLV or LTV)
Customer lifetime value (also referred to as CLV or LTV) measures how much a customer will spend throughout their relationship with your business. It considers the amount and frequency of the customer’s spending, which can reflect their sentiment towards your brand and their level of engagement.
Senior stakeholders commonly use CLV or LTV as an indication of a business’ profitability, customer satisfaction, and long-term growth strategy. A “good” CLV/LTV is generally three times the customer acquisition cost (CAC).
How to Calculate Customer Lifetime Value
CLV = Customer value* X Average customer lifespan
*To calculate the customer value: Average purchase value X Average number of purchases
6. Average Session Duration
Marketers and sales teams work hard to connect with customers via digital channels. The average session duration calculates the amount of time a visitor spends on your app, website, or platform in a single visit.
The longer the time spent on a website tends to align with higher customer engagement and interest. You can also dig deeper into the average session duration to discover insights like which content or webpages are the most compelling and which products customers search for.
Creative teams like web development, user experience (UX), copywriters, and content marketers can help you optimize pages with a low session duration by changing the web design, CTAs, or images.
How to Calculate Average Session Duration
Average session duration = Total duration of all sessions during time period / Total number of sessions during time period
7. Customer Churn Rate

Source
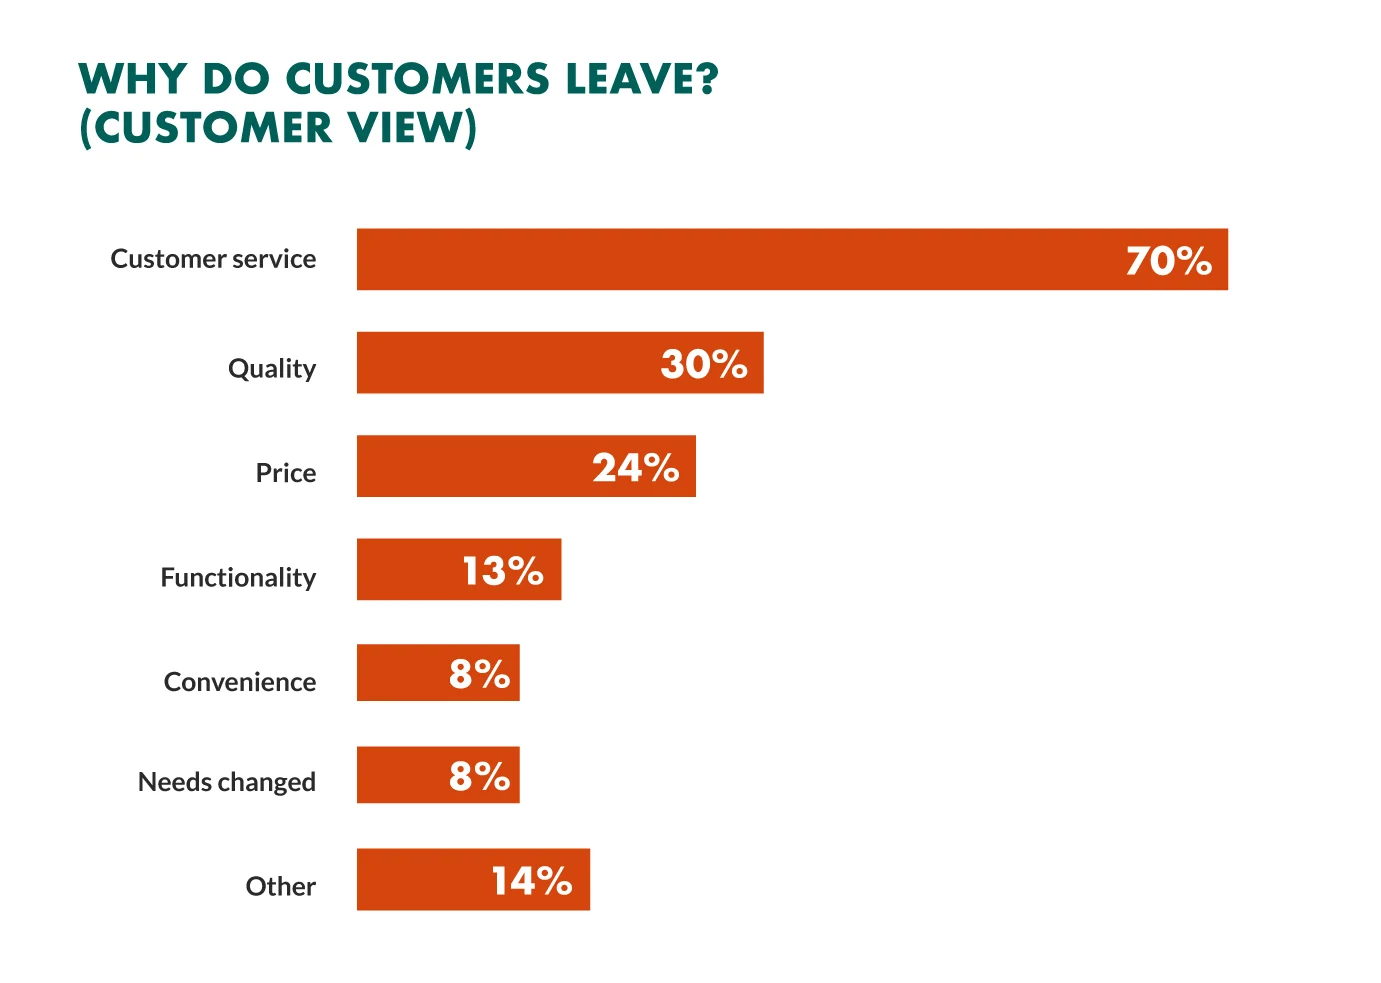
Unfortunately, some customers will drift down the stream. Customer churn rate calculates the percentage of customers who abandon your brand in some way, whether they cancel a subscription, don’t renew their contract, or stop buying your products. Churn is the ultimate indicator that customers are failing to engage with your business.
Lowering the churn rate is essential for improving the profitability and longevity of your business. A high churn rate often signals a disconnect between your brand and your customers. Analyzing this metric can reveal areas for improvement in your products, services, or customer experience, enabling you to take proactive steps to retain valuable customers.
How to Calculate Customer Churn Rate
Churn rate (%) = [Number of customers lost over period / Number of customers at beginning of period] X 100
3 Ways to Leverage Customer Engagement Analytics for Your Business
The data you gain from customer engagement analytics is like gold dust, and it is invaluable for the success and growth of your business. After all, what’s the point in tracking various metrics if you don’t do anything with the results?
1. Build Better Loyalty Programs
A great loyalty program is one of the most effective ways to connect with your users and reward those who show continued commitment to your brand. Using customer engagement analytics, you can target your most satisfied and loyal advocates with exclusive promotions—and address any negative feedback you’ve received with a relevant coupon to sweeten the deal, too.
2. Create Granular Customer Segmentation
Customer engagement analytics help you identify your most and least-engaged customers, plus everyone in between. You can group users based on how active and loyal they are and tailor communications to their unique needs and positioning in the customer lifecycle. For example, you could display different messages to different audiences based on their behavior, preferences, or loyalty membership.
3. Personalize More Communications
89% of marketers see a positive ROI when they use personalization in their campaigns. Data like customer engagement analytics can be the foundation for building personalized videos, ads, and other content. Personalized experiences deepen user relationships, increase customer engagement, and boost lifetime value.
Skyrocket Engagement Rates 2.5X With Personalized Videos
Data really is your organization’s most valuable asset—so, use it to its full potential. Customer engagement analytics can inform next-gen and innovative marketing strategies that capture your users’ attention and keep them engaged.
Blings enables you to create millions of personalized video journeys, tailored to each customer’s unique experiences with your brand. How is personalization possible on this scale? Blings dynamically creates unlimited video variations from a single template using product or user data, such as available engagement metrics or their positioning in the sales funnel.
With Blings, you can take customer engagement one step further by transforming video content from passive to active. Create interactive journeys using forms, buttons, chatbots, and more—without worrying about the file size. Using a patented MP5 technology, all Blings videos are lightweight and sharp, at least 100X smaller than typical MP4 files while maintaining full HD resolution on any screen size.
Book a demo to explore how you can deliver memorable customer experiences using the data you already have.


